How a Storm Becomes a Moving Signal
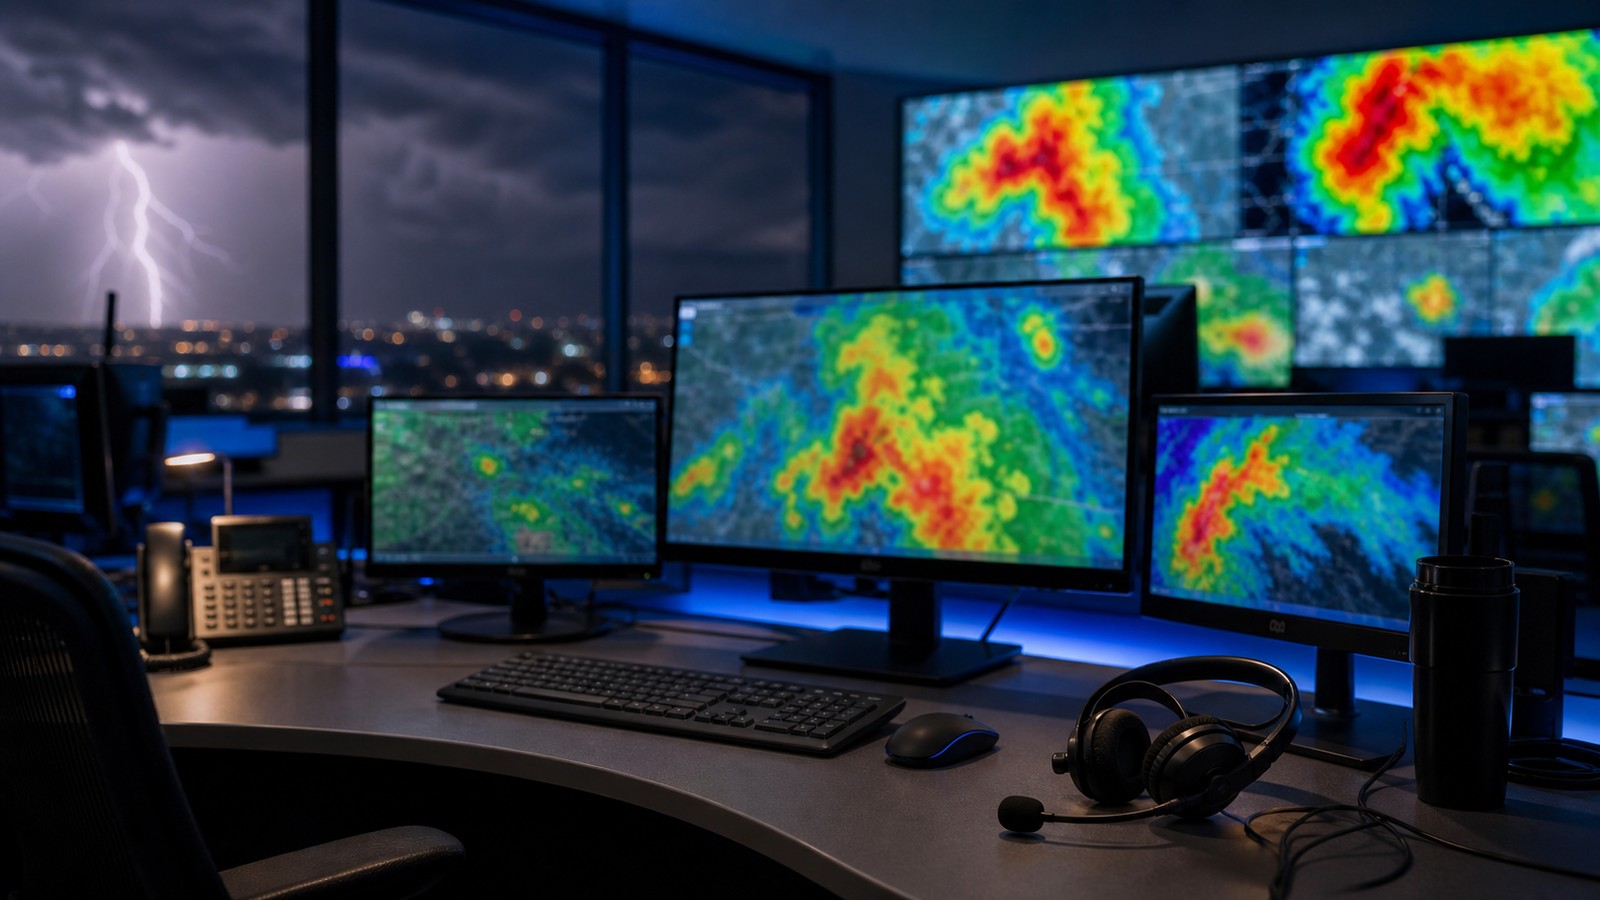
Real-time storm tracking begins with a simple idea carried out at extraordinary speed: send energy into the atmosphere, measure what comes back, compare it with other observations, and update the picture as the storm moves. A live radar map may look like a smooth animation, but it is built from thousands of measurements, quality checks, calculations, and interpretations. Radar pulses reveal where precipitation is falling. Doppler velocity shows whether raindrops, hail, or debris are moving toward or away from the radar. Dual-polarization data helps identify particle shape and type. Satellites show cloud growth above the storm, surface stations show what is feeding it near the ground, and forecast models estimate where the environment may support the next change. The result is not a magic window into the future. It is a fast-updating evidence system that helps meteorologists follow storms minute by minute and warn people before the worst weather arrives.
A: It is near real time, but scanning, processing, and app delivery create a delay.
A: It shows the strength of returned radar energy, often related to precipitation intensity.
A: It reveals wind motion that can indicate rotation, outflow, and storm organization.
A: No. Radar can show strong evidence, but low-level features may be hard to sample.
A: It helps identify particle type, shape, and possible debris signatures.
A: Storms can split, merge, weaken, intensify, or turn as the environment changes.
A: No. Official warnings should trigger action before visual confirmation.
A: It can suggest hail potential, but exact size at the ground remains uncertain.
A: The radar beam samples higher above the ground as distance increases.
A: Agreement between radar, velocity, dual-pol, satellite, reports, and warnings.
Radar Sends the First Question Into the Storm
Weather radar works by transmitting short pulses of electromagnetic energy into the atmosphere. When those pulses strike raindrops, snowflakes, hailstones, insects, dust, or debris, a small portion of the energy scatters back toward the radar dish. The radar measures how strong the returned signal is and how long it took to return. Time reveals distance. Signal strength helps estimate how much material is in the air.
That returned energy becomes reflectivity, the familiar color shading on radar maps. Light precipitation may appear as weaker colors, while intense rain or hail produces stronger returns. Reflectivity is the first layer most people recognize because it answers the basic question: where is precipitation right now? For storm tracking, that is only the beginning.
Radar does not scan the whole sky at once. It samples the atmosphere in slices at different elevation angles. Close to the radar, a low scan may be near the ground. Farther away, the same beam is higher above the surface because Earth curves and the beam rises. Meteorologists account for that geometry when judging whether a storm feature is near people or several thousand feet above them.
Doppler Velocity Adds Motion
Doppler radar measures movement by detecting tiny frequency shifts in the returned signal. If particles are moving toward the radar, the return shifts one way. If they are moving away, it shifts the other way. This creates velocity data, which is essential for identifying wind patterns inside storms. A reflectivity image can show a strong thunderstorm; velocity can reveal rotation, outflow winds, or converging air.
Velocity is one reason modern storm tracking can move so quickly. Meteorologists can watch for tightening rotation in a supercell, strong inbound or outbound wind signatures, and boundaries that may trigger new storm growth. The data is not interpreted by color alone. The key is the pattern: where opposing winds sit next to each other, how persistent the signal is, whether it lines up with storm structure, and whether other evidence supports it.
This is also why live maps can look confusing to casual users. Velocity colors do not simply mean “bad” or “safe.” They depend on the radar’s location and viewing angle. A trained forecaster reads them as motion relative to the radar, then places that motion inside the larger storm environment.
Dual-Polarization Helps Identify What Is Falling
Dual-polarization radar sends and receives energy in both horizontal and vertical orientations. That extra perspective helps estimate the shape, size, and variety of particles in the beam. Rain, hail, snow, melting flakes, and non-weather debris can reflect energy differently. For severe storms, dual-pol data can help meteorologists distinguish heavy rain from hail and, in some cases, detect debris lofted by a tornado.
One useful product is correlation coefficient, which shows how similar the particles in a sampled area appear. Ordinary rain tends to be more uniform. Mixed debris can be less uniform. When a suspicious low correlation area appears near strong rotation and a damaging storm report, it can support the conclusion that a tornado is producing debris. That kind of clue is powerful, but it must be interpreted carefully and in context.
Storm Tracking Uses More Than Radar
Radar is central, but real-time tracking is stronger when multiple observing systems agree. Satellites show cloud-top cooling, overshooting tops, and the broader growth of convective storms. Lightning networks reveal where charge separation is intensifying. Surface stations show wind shifts, pressure changes, dew point gradients, and boundaries that can feed or focus storms.
Spotter reports, emergency management updates, traffic cameras, aircraft observations, and public reports can add ground truth. A radar signature may suggest large hail, but a report confirms what reached the surface. A velocity couplet may suggest damaging wind, while a measured gust shows how strong it became at ground level. Good storm tracking blends remote sensing with real-world confirmation.
Forecast models add another layer. Short-range models and rapid-update systems help estimate how storms may evolve in the next hour or two. They do not replace radar, because radar shows what is happening now. Instead, models provide environmental context: instability, wind shear, moisture, boundaries, and storm motion. The best nowcasting uses observation first and model guidance second.
How Live Maps Estimate Where a Storm Goes Next
Most live storm maps use recent radar frames to estimate motion. If a storm cell has moved northeast over the last several scans, the system can project that motion forward and display a track. This is useful for short lead times, especially when storms are moving steadily. It helps show which towns, roads, or neighborhoods may be next in line.
Storm motion is not always simple. Thunderstorms can grow, split, merge, accelerate, weaken, or turn. A supercell may deviate from the general wind flow. A line of storms may bow outward as damaging winds surge ahead. New cells can form along an outflow boundary while the old cell fades. Real-time tracking has to update constantly because the object being tracked is changing shape.
That is why a live map should be read as guidance, not a guarantee. The track cone or projected path is strongest when the storm is organized and persistent. It is weaker when storms are pulsing, scattered, or rapidly developing. Meteorologists watch both the algorithm and the atmosphere, adjusting the message when the storm stops behaving like its recent past.
Alerts Turn Tracking Into Action
Storm tracking matters because people need time to act. When radar, observations, and environmental analysis show a threat, meteorologists can issue warnings for tornadoes, severe thunderstorms, flash flooding, or other hazards. The warning is not just a colored polygon. It is a decision that the evidence has reached an action threshold.
Lead time depends on the hazard. A rotating supercell may provide several radar scans of concern before a tornado warning. A sudden microburst can develop quickly. Flash flooding may depend on rainfall rates over a basin and what has already fallen. Lightning can threaten before the heaviest rain reaches a location. Real-time tracking helps narrow the geography and timing, but each hazard has its own warning rhythm.
For the public, the safest habit is to treat official warnings as action messages. A live radar app is useful for awareness, but it should not become a reason to wait for visual confirmation. If a warning says shelter, move first and analyze later.
Why Radar Images Lag Reality
Even “live” storm tracking has a delay. The radar must scan the atmosphere, process the return, distribute the data, and display it through an app or website. The image on a phone may be several minutes behind the actual storm. During fast-moving severe weather, several minutes can place the leading edge, hail core, or circulation noticeably closer than it appears.
There is also a difference between base data and smoothed consumer displays. Some apps simplify radar for readability, while professional tools may show more products and faster updates. Neither is automatically wrong. The key is knowing what you are looking at. A clean animation is helpful for general motion; deeper products are needed for detailed warning decisions.
Scan Strategy Changes the Update Rhythm
Radar operators and automated systems can use different scanning strategies depending on the weather situation. During quiet weather, the radar may spend more time sampling a broad volume of the atmosphere. During severe convection, faster low-level updates can become more valuable because the most dangerous changes may occur near the ground and within a few minutes. The chosen strategy affects how quickly new information reaches forecasters.
This matters for storm tracking because a rapidly intensifying storm can change between frames. A circulation may tighten, a bowing segment may accelerate, or a hail core may descend while the previous image is still being shared. Faster updates improve situational awareness, but they do not remove the need for interpretation. A quick scan still has geometry limits, noise, and context questions. Speed helps most when paired with a forecaster who understands what changed and why it matters.
Algorithms Assist, Forecasters Decide
Live maps often draw tracks, identify rotation, estimate hail, and highlight heavy rain automatically. Those tools are useful because they scan enormous amounts of data faster than a human could by hand. They can flag features worth attention and help maintain consistency during busy outbreaks. Automation is especially helpful when many storms are active at once.
But storm tracking is not a simple handoff from radar to software to warning. Algorithms can be fooled by clutter, beam angle, storm mergers, range issues, or unusual storm structure. A forecaster checks whether the automated signal makes meteorological sense. Is the rotation located in the right part of the storm? Is the hail estimate supported by dual-pol data and storm height? Is the projected track following a persistent cell or a cluster that is reorganizing?
The human role is judgment under time pressure. Meteorologists combine the algorithmic flags with radar interrogation, environmental analysis, reports, and warning policy. That is why two maps can display the same storm while the official message carries more authority. The map shows data; the warning expresses a decision that the data has crossed a public-safety threshold.
What Real-Time Tracking Can and Cannot Do
Real-time tracking can show where a storm is, how it is moving, whether it is strengthening, and whether radar signatures suggest specific hazards. It can improve warning precision, reveal dangerous trends, and help people make decisions before a storm arrives. It is one of the most important advances in modern weather safety.
It cannot see every hazard perfectly. Radar beams can overshoot low-level features far from the radar. Terrain can block or distort signals. Hail size estimates can be uncertain. Tornado debris signatures may appear only after damage has started and only when debris is lofted high enough. Flash flooding depends on ground conditions, drainage, and rainfall history, not just current radar color.
The most reliable storm awareness comes from using live tracking with official warnings, local forecast discussion, and common-sense shelter decisions. Radar gives the moving picture. Meteorologists provide interpretation. People provide the final safety action.