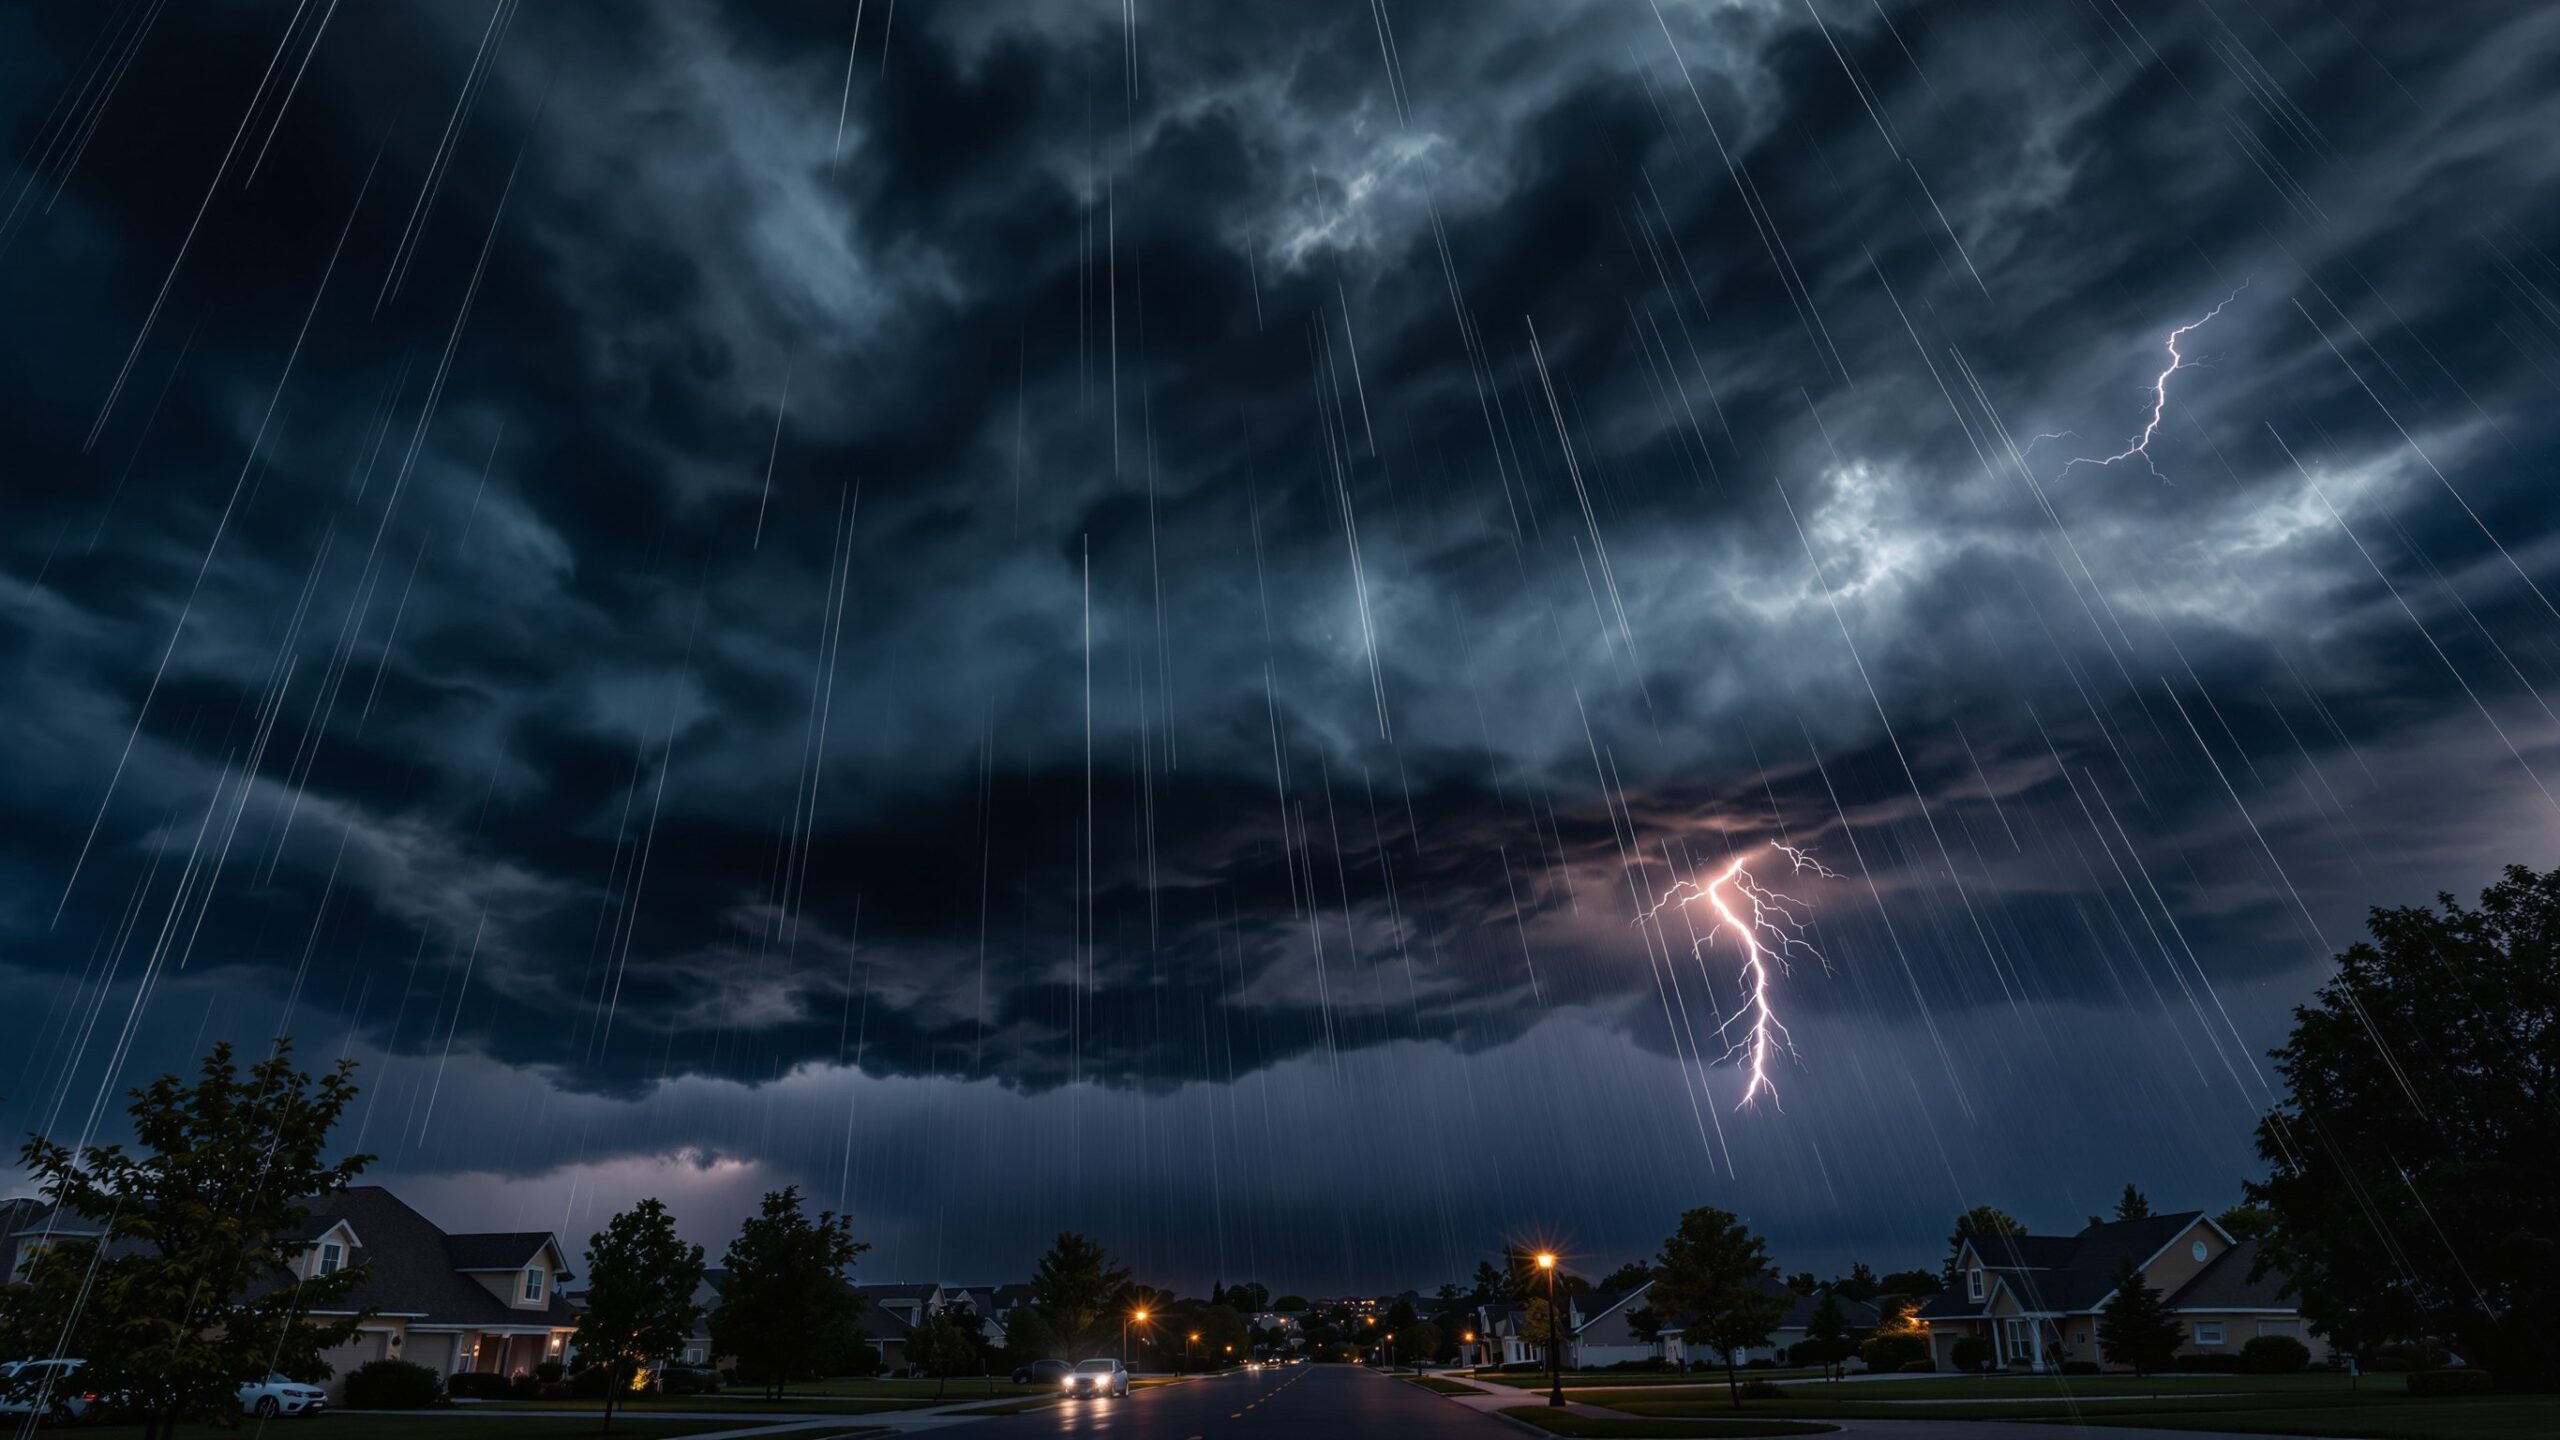
How to Read Doppler Radar Like a Meteorologist
Weather radar is one of the most powerful tools in modern forecasting, transforming invisible atmospheric motion into vivid, interpretable data. To the untrained eye, Doppler radar maps can look like colorful abstractions—greens, yellows, reds, and purples swirling across a screen. But to a meteorologist, every shade, shape, and movement tells a story about wind, precipitation, storm intensity, and even potential danger. Learning how to read Doppler radar like a professional unlocks a deeper understanding of weather systems and gives you a practical edge in tracking storms in real time. This guide takes you inside the science and interpretation techniques meteorologists use every day, translating complex radar data into clear, actionable insight.
A: It’s a logarithmic measure of reflectivity—higher values mean stronger precipitation.
A: That’s virga—precipitation evaporates before hitting the surface.
A: It detects rotation and debris signatures, not the funnel itself.
A: The radar beam is higher and less precise at long distances.
A: A curved radar signature linked to rotating supercells and tornado potential.
A: Terrain and distance can block or limit radar signals.
A: Wind direction and speed toward or away from the radar.
A: Typically every 4–6 minutes depending on scan mode.
A: It estimates it, but snow density makes it less precise than rain.
A: Beam height and obstruction can prevent accurate low-level observations.
What Doppler Radar Actually Measures
At its core, Doppler radar is a remote sensing system that emits pulses of microwave energy into the atmosphere. When these waves encounter precipitation particles—such as raindrops, snowflakes, or hail—they scatter energy back to the radar dish. By measuring the time it takes for the signal to return, the radar calculates the distance to the target. This is how meteorologists determine where precipitation is located.
However, Doppler radar goes further. It also measures the frequency shift of the returning signal, known as the Doppler effect. If precipitation particles are moving toward the radar, the frequency increases; if they are moving away, it decreases. This allows meteorologists to assess wind velocity within storms, revealing rotation, divergence, and other dynamic behaviors that are invisible to standard radar.
Understanding that Doppler radar provides both reflectivity and velocity data is essential. Reflectivity shows what is falling from the sky, while velocity shows how the air itself is moving. Together, they form a comprehensive picture of atmospheric activity.
Decoding Reflectivity: What the Colors Mean
Reflectivity is the most familiar radar product, often displayed as a color-coded map. Each color corresponds to the intensity of returned radar signals, which correlates with precipitation strength. Light greens typically indicate light rain or drizzle, while darker greens and yellows suggest moderate rainfall. Oranges and reds signal heavy rain, and deep reds or purples often point to intense storms, potentially including hail.
Meteorologists do not simply look at colors in isolation. They analyze gradients, shapes, and continuity. A smooth gradient from green to yellow may indicate steady rain, while sharp transitions to red or purple suggest strong convective activity. A small but intense red core embedded in a storm can indicate a powerful updraft capable of producing hail.
Another critical factor is reflectivity height. High reflectivity values at higher altitudes can signal strong storm development. Meteorologists often examine vertical cross-sections to understand storm structure, something that adds depth beyond the standard two-dimensional radar image.
Velocity Data: Seeing the Wind Inside the Storm
Velocity radar products are where Doppler technology truly shines. Instead of showing precipitation intensity, velocity maps display wind motion relative to the radar. Typically, green shades indicate motion toward the radar, while red shades indicate motion away from it.
When meteorologists analyze velocity, they look for patterns rather than isolated colors. One of the most important signatures is the presence of adjacent inbound and outbound velocities. This pattern, known as a velocity couplet, can indicate rotation within a storm. If the couplet is tight and intense, it may signal a developing or ongoing tornado.
Velocity data also helps identify divergence and convergence. Divergence occurs when winds spread apart, often indicating downdrafts or outflow boundaries. Convergence, on the other hand, occurs when winds come together, which can enhance storm development and intensification.
By combining velocity data with reflectivity, meteorologists can determine not just where storms are, but how they are evolving and whether they pose a threat.
Understanding Radar Resolution and Limitations
Doppler radar is powerful, but it is not perfect. One of the key limitations is beam geometry. As the radar beam travels outward, it rises in altitude due to the curvature of the Earth. This means that at greater distances, the radar is sampling higher levels of the atmosphere rather than near the ground. A storm that appears weak at long range may actually be strong near the surface, simply because the radar is missing the lower portion.
Another limitation is attenuation, where heavy precipitation absorbs or scatters radar energy, reducing the signal behind it. This can create areas of artificially low reflectivity, masking additional storm activity.
Ground clutter is another factor to consider. Objects such as buildings, terrain, and even insects can produce radar returns that are not related to precipitation. Meteorologists use filtering techniques to minimize clutter, but it can still appear on radar displays.
Recognizing these limitations is essential for accurate interpretation. Professionals always consider radar context, distance, and environmental conditions before drawing conclusions.
Identifying Storm Structures on Radar
Meteorologists are trained to recognize specific storm structures through radar signatures. One of the most well-known is the supercell, a rotating thunderstorm capable of producing severe weather. On reflectivity radar, a supercell often displays a hook echo—a curved appendage extending from the main storm core. This feature indicates the presence of rotation and is closely associated with tornado formation.
Another important structure is the squall line, a linear band of storms often associated with strong winds and heavy rain. On radar, squall lines appear as elongated, continuous bands of high reflectivity. Embedded bow echoes within these lines can indicate areas of particularly wind damage potential.
Pulse storms, which are short-lived and less organized, appear as isolated cells that rapidly intensify and dissipate. Their radar signatures are more diffuse and less structured than those of organized systems.
Understanding these structures allows meteorologists to anticipate storm behavior, including movement, intensification, and potential hazards.
The Role of Dual-Polarization Radar
Modern Doppler radar systems often include dual-polarization capabilities, which significantly enhance interpretation. Dual-pol radar sends out both horizontal and vertical pulses, allowing it to analyze the shape and orientation of precipitation particles.
This technology enables meteorologists to distinguish between rain, snow, sleet, and hail. It can also identify non-meteorological targets such as debris. During a tornado, dual-pol radar may detect a debris signature, confirming that the storm is causing damage on the ground.
Dual-polarization also improves rainfall estimation and helps identify melting layers in the atmosphere. These insights provide a more nuanced understanding of storm dynamics and precipitation type.
Tracking Storm Movement and Timing
Reading Doppler radar is not just about interpreting a single frame. Meteorologists analyze radar loops to track storm movement and evolution over time. By observing how storms change frame by frame, they can estimate speed, direction, and future position.
Storm motion is influenced by larger atmospheric patterns, including wind shear and pressure systems. Radar loops reveal whether a storm is strengthening, weakening, or splitting. A storm that consistently intensifies on radar may warrant closer monitoring for severe weather.
Timing is critical for public safety. Meteorologists use radar data to issue warnings, estimate arrival times, and communicate risk. By learning to read radar loops, you can anticipate weather changes before they happen.
Recognizing Severe Weather Signatures
Certain radar signatures are strongly associated with severe weather. Beyond the hook echo and velocity couplet, meteorologists look for features such as bounded weak echo regions, which indicate strong updrafts. These areas appear as low reflectivity surrounded by higher reflectivity and are often associated with hail formation.
Another key feature is the presence of high reflectivity cores, especially when combined with strong velocity patterns. These cores can signal large hail or intense rainfall.
Meteorologists also monitor storm tops and echo growth. Rapid vertical development often precedes severe weather, as it indicates strong atmospheric instability and energy.
By identifying these signatures, professionals can assess risk levels and issue timely warnings.
How Meteorologists Combine Radar with Other Data
Doppler radar is just one piece of the forecasting puzzle. Meteorologists integrate radar data with satellite imagery, surface observations, and atmospheric models to build a comprehensive understanding of weather systems.
Satellite data provides a broader view of cloud cover and large-scale patterns, while surface observations offer ground truth for temperature, humidity, and wind conditions. Weather models predict future conditions based on complex simulations.
By combining these data sources, meteorologists can validate radar interpretations and refine their forecasts. This multi-layered approach ensures accuracy and reliability.
Practical Tips for Reading Radar Like a Pro
Developing radar interpretation skills requires practice and attention to detail. Start by focusing on patterns rather than individual colors. Look at how storms evolve over time, and pay attention to the relationship between reflectivity and velocity.
Consider the radar’s location and distance from the storm. Remember that data quality decreases with range. Be aware of environmental conditions, such as temperature and humidity, which influence precipitation type and intensity.
Use multiple radar products when possible. Reflectivity, velocity, and dual-polarization data each provide unique insights. By combining them, you gain a more complete picture.
Finally, stay informed about local weather patterns. Familiarity with regional climatology helps you interpret radar data more effectively.
The Future of Doppler Radar Technology
Radar technology continues to evolve, with advancements aimed at improving resolution, accuracy, and coverage. Phased array radar systems, for example, can scan the atmosphere more rapidly, providing near real-time updates. This allows meteorologists to detect changes in storm structure faster than ever before.
Artificial intelligence and machine learning are also playing a growing role. These technologies can analyze vast amounts of radar data, identifying patterns and anomalies that may be difficult for humans to detect.
As these innovations continue, the ability to interpret radar data will become even more valuable, both for professionals and for informed weather enthusiasts.
Turning Data Into Insight
Reading Doppler radar like a meteorologist is not about memorizing colors or symbols. It is about understanding the physics behind the data and recognizing patterns that reveal how the atmosphere is behaving. Each radar image is a snapshot of a dynamic system, full of motion, energy, and potential.
By learning to interpret reflectivity, velocity, and advanced radar products, you can move beyond surface-level observations and gain a deeper appreciation for the science of weather. Whether you are tracking a summer thunderstorm or monitoring a developing severe weather event, Doppler radar offers a window into the invisible forces shaping our environment. With practice, patience, and curiosity, you can begin to see what meteorologists see: not just a map, but a story unfolding in real time.