Satellite Weather Maps: A Beginner’s Guide to Understanding Cloud Systems
Weather has always shaped human life, from agriculture and travel to safety and daily decision-making. Today, one of the most powerful tools used to understand and predict weather is the satellite weather map. These images, captured from space, provide a dynamic and expansive view of Earth’s atmosphere, revealing cloud patterns, storm systems, and atmospheric behavior in real time. For beginners, satellite weather maps may seem complex at first glance, but with a foundational understanding, they become an invaluable window into how weather works. This guide breaks down the essentials of satellite weather maps, helping you interpret cloud systems, recognize key patterns, and build confidence in reading these sophisticated visual tools.
A: Visible shows reflected light; infrared shows temperature differences.
A: They reflect sunlight strongly or emit less heat than surroundings.
A: Most cannot; thick clouds block surface visibility.
A: It often indicates very cold, high cloud tops in enhanced imagery.
A: Typically every 5–15 minutes for geostationary satellites.
A: The highest visible part of a cloud, often used to gauge storm intensity.
A: Due to Earth’s rotation and pressure differences.
A: Tracking moisture and upper-level atmospheric patterns.
A: They are tools—accuracy improves when combined with models and radar.
A: Yes, by observing cloud motion and patterns over time.
What Are Satellite Weather Maps?
Satellite weather maps are visual representations of Earth’s atmosphere captured by orbiting satellites. These satellites continuously monitor the planet, collecting data about clouds, temperature, moisture, and atmospheric movement. The data is then processed into images that meteorologists—and increasingly the general public—use to analyze weather conditions.
Unlike traditional weather maps that rely on ground-based observations, satellite imagery provides a comprehensive, global perspective. This allows users to see weather systems developing over oceans, remote regions, and areas with limited weather stations. The result is a more complete understanding of how storms form, evolve, and move.
Satellite maps are especially useful for tracking large-scale systems such as hurricanes, cold fronts, and jet streams. They also play a crucial role in forecasting, enabling meteorologists to predict weather patterns days in advance with increasing accuracy.
Types of Satellite Imagery
To effectively interpret satellite weather maps, it’s important to understand the different types of imagery available. Each type highlights specific atmospheric features and serves a distinct purpose.
Visible imagery is the most intuitive. It captures sunlight reflected off clouds and Earth’s surface, producing images that resemble photographs. In these maps, thick clouds appear bright white, while land and water appear darker. Visible imagery is ideal for identifying cloud shapes, structures, and movement during daylight hours.
Infrared imagery, on the other hand, measures temperature rather than reflected light. This allows it to function both day and night. In infrared maps, colder objects—such as high cloud tops—appear brighter, while warmer surfaces appear darker. This makes infrared imagery particularly valuable for identifying storm intensity, as towering storm clouds are typically colder and therefore more prominent.
Water vapor imagery focuses on moisture in the atmosphere, especially in the mid to upper levels. These maps highlight areas of high and low humidity, helping users track jet streams and identify regions where storms may develop. Water vapor imagery often appears in shades of gray or color-enhanced gradients, making it easier to visualize atmospheric dynamics.
Understanding Cloud Systems
Clouds are the most visible elements on satellite weather maps, and learning to interpret them is key to understanding weather patterns. Different cloud types and formations can signal specific atmospheric conditions.
Cumulus clouds, which appear as puffy, cotton-like formations, often indicate fair weather when isolated. However, when they grow vertically into towering cumulonimbus clouds, they can signal thunderstorms, heavy rain, or even severe weather such as hail and tornadoes.
Stratus clouds form in layers, creating a uniform gray or white blanket across the sky. On satellite maps, they appear as broad, featureless areas. These clouds are typically associated with overcast conditions and light precipitation.
Cirrus clouds are thin, wispy, and found at high altitudes. They may appear faint on visible imagery but are more noticeable in infrared maps due to their cold temperatures. Cirrus clouds often indicate stable conditions but can also signal changes in the weather, especially when they precede a storm system.
By observing how these cloud types cluster, evolve, and move, you can begin to interpret the story behind the weather.
Identifying Weather Systems from Space
Satellite weather maps are particularly powerful for identifying large-scale weather systems. Recognizing these patterns is a major step toward understanding atmospheric behavior.
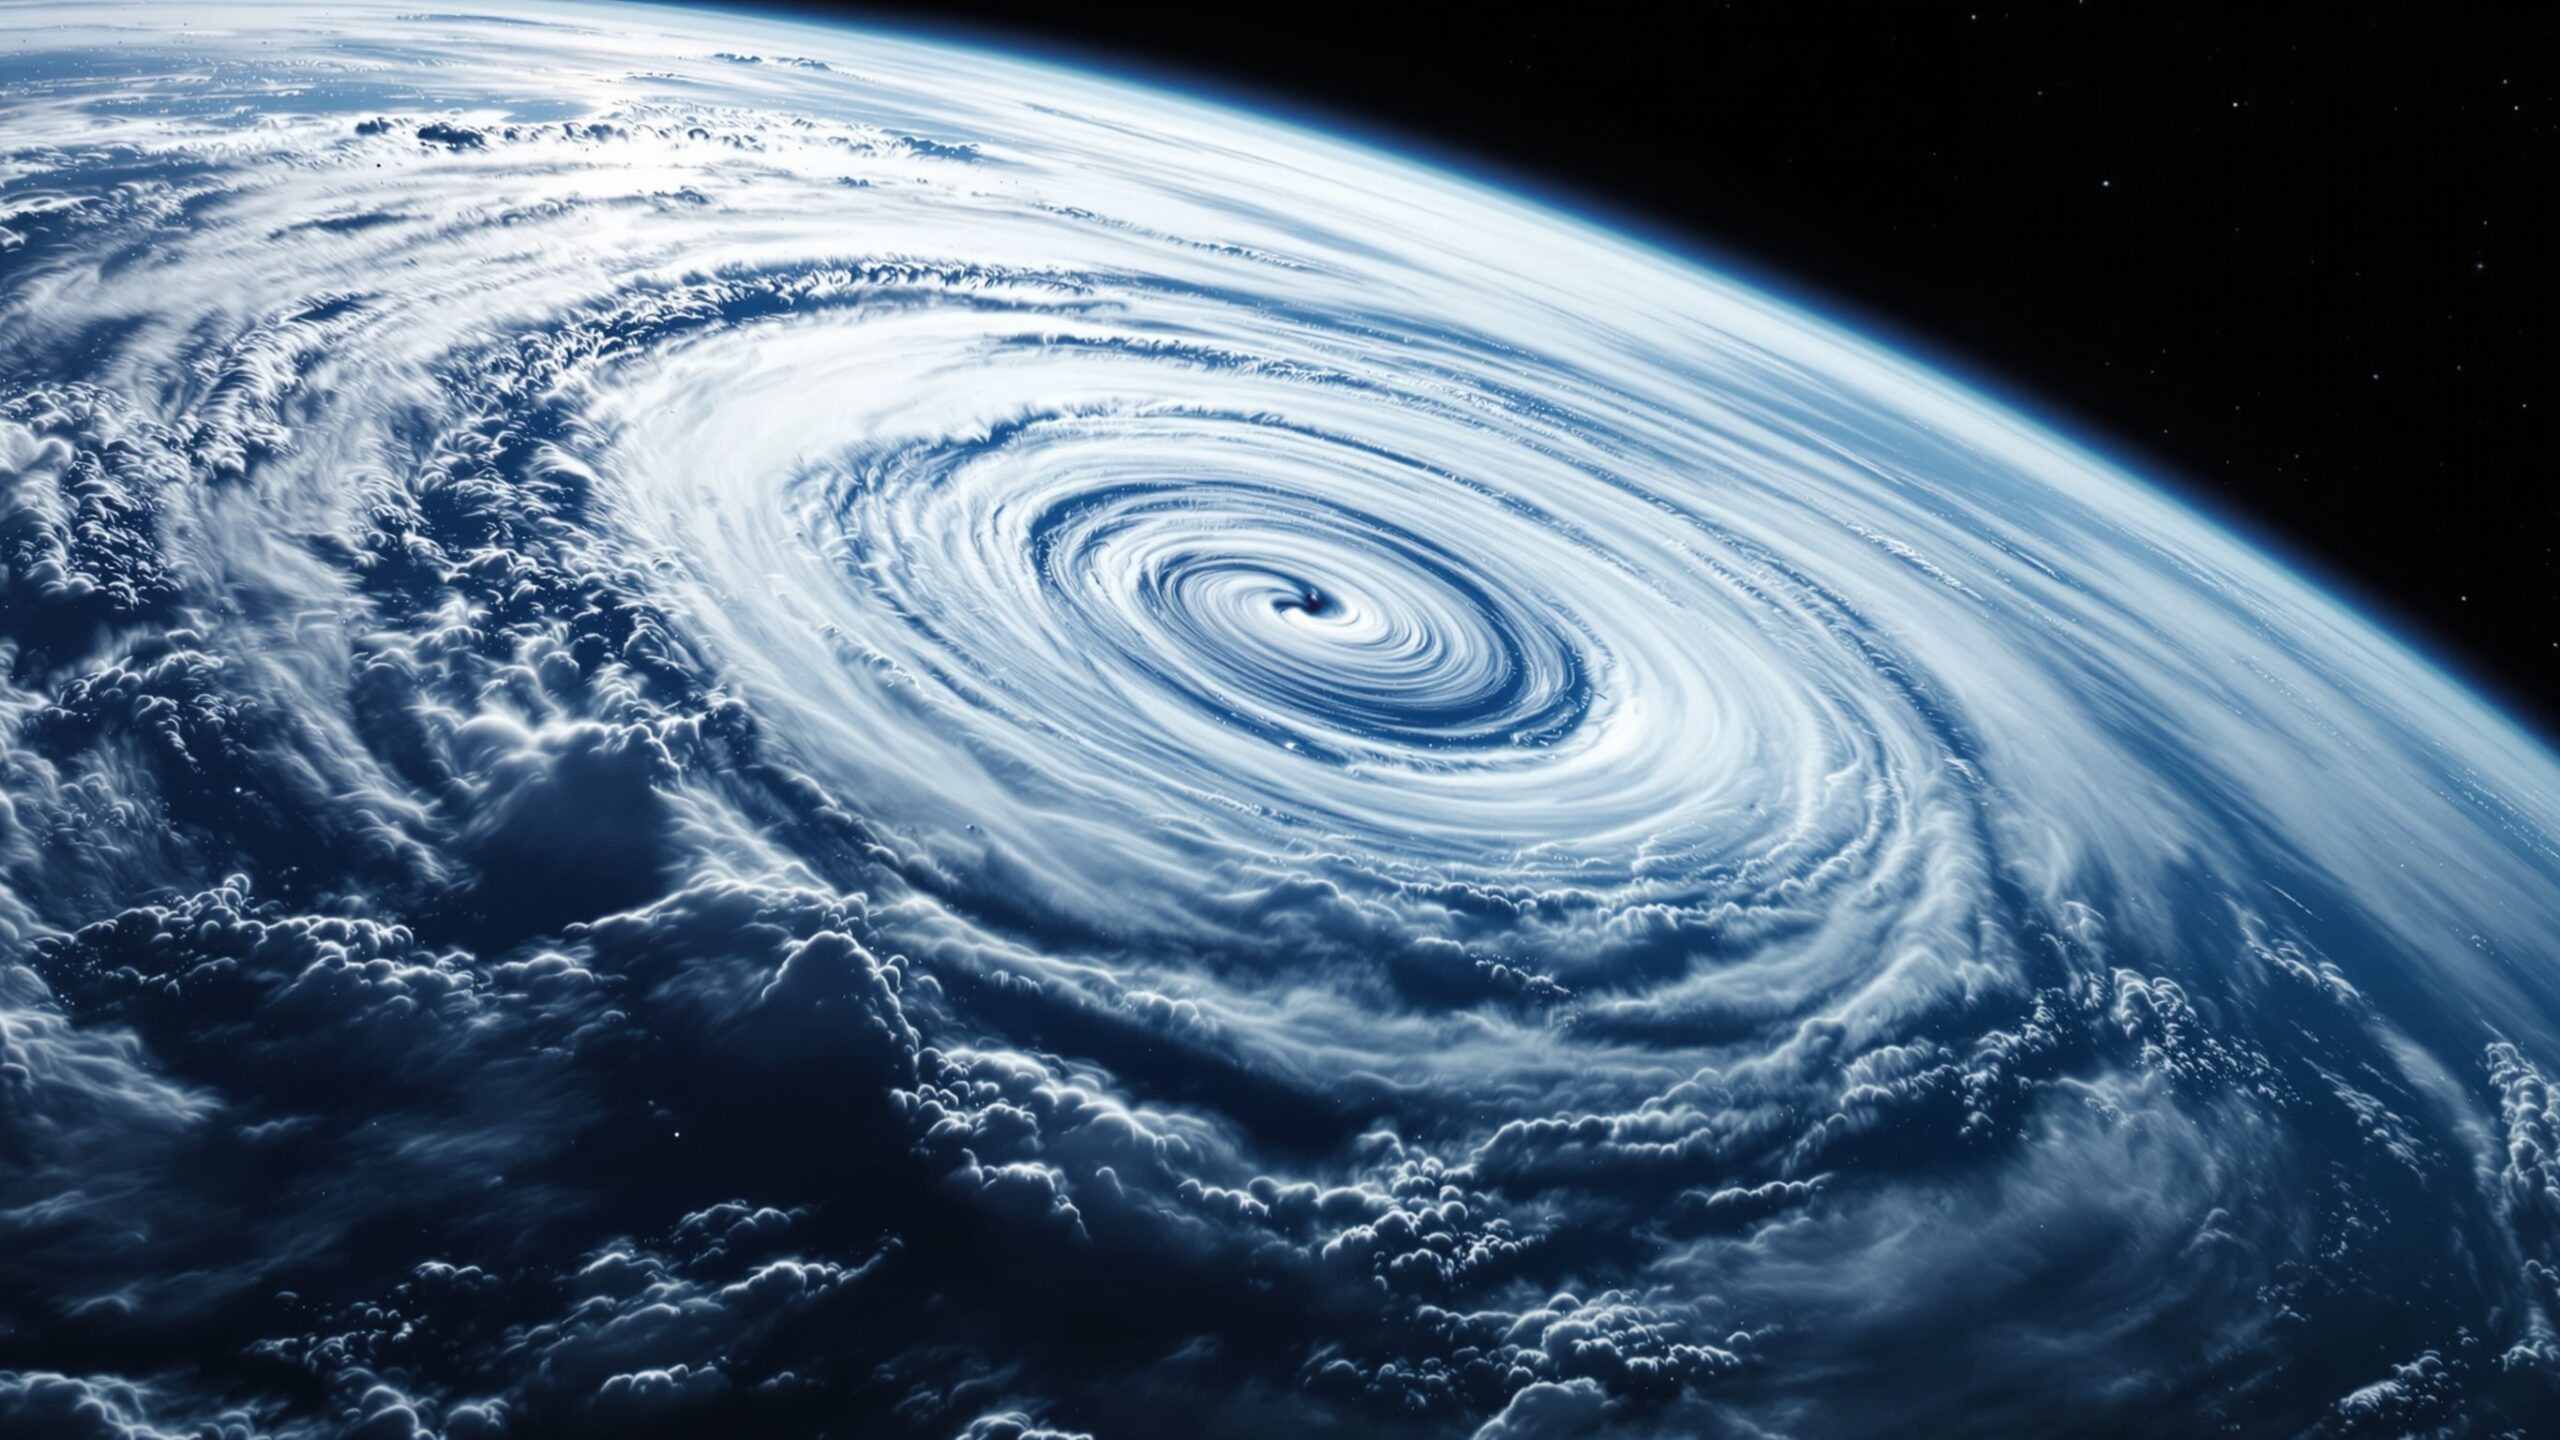
One of the most distinctive features is the spiral pattern of a cyclone. This swirling formation, visible in both visible and infrared imagery, indicates a low-pressure system. In the Northern Hemisphere, these systems rotate counterclockwise and are often associated with storms, precipitation, and unsettled weather.
High-pressure systems, in contrast, are characterized by clearer skies and fewer clouds. On satellite maps, they often appear as large, cloud-free regions. These systems generally bring stable and calm weather conditions.
Frontal boundaries, where different air masses meet, can also be identified. Cold fronts often appear as sharp lines of clouds, sometimes accompanied by thunderstorms. Warm fronts, on the other hand, typically show more gradual cloud transitions and widespread precipitation.
Tropical systems such as hurricanes and typhoons are among the most dramatic features visible on satellite maps. Their well-defined eye, spiral rainbands, and dense cloud cover make them easy to identify. Monitoring these systems is critical for forecasting and public safety.
The Role of Color Enhancement
Modern satellite weather maps often use color enhancement to make interpretation easier. These colors are not always natural but are applied to highlight specific features.
In infrared imagery, color gradients are used to represent temperature differences. For example, deep reds or purples may indicate very cold cloud tops, which are often associated with intense storms. Warmer areas might appear in yellows or greens.
Water vapor imagery also uses color to show moisture levels. Areas of high moisture may appear in bright colors, while dry regions are shown in darker tones. This helps users quickly identify areas of atmospheric instability.
Understanding that these colors are symbolic rather than literal is important. Once you learn what each color represents, you can extract valuable insights from even the most complex images.
Tracking Storm Development
One of the most practical applications of satellite weather maps is tracking storm development. By observing changes over time, you can see how weather systems evolve and anticipate their impact.
Storms often begin as clusters of clouds that grow and organize. On satellite maps, this might appear as a group of bright, cold cloud tops that expand and intensify. As the system develops, it may form a more defined structure, such as a spiral or line.
Time-lapse sequences, often called satellite loops, are especially useful. These animations show how clouds move and change, revealing wind patterns and system progression. By watching a loop, you can identify the direction and speed of a storm, as well as areas where it may strengthen or weaken.
This dynamic perspective transforms satellite maps from static images into powerful forecasting tools.
Common Mistakes Beginners Make
While satellite weather maps are accessible, beginners often misinterpret key features. One common mistake is assuming that all bright clouds indicate severe weather. In reality, brightness in visible imagery simply reflects thickness and sunlight, not necessarily intensity.
Another frequent error is ignoring the type of imagery being used. Interpreting an infrared image as if it were a visible one can lead to confusion, especially when colors are involved.
Beginners may also overlook scale and context. A small cluster of clouds might seem significant but could be relatively minor when viewed in the context of a larger system. Understanding the broader atmospheric picture is essential.
By being aware of these pitfalls, you can develop more accurate interpretations and avoid common misconceptions.
How Meteorologists Use Satellite Maps
Professional meteorologists rely heavily on satellite weather maps as part of a broader toolkit. These maps are integrated with data from radar, weather stations, and computer models to create comprehensive forecasts.
Satellite imagery provides real-time insights into areas where other data sources are limited, such as oceans and remote regions. This is particularly important for tracking hurricanes and monitoring global weather patterns.
Meteorologists also use satellite data to validate and refine forecast models. By comparing predicted conditions with actual satellite observations, they can adjust their forecasts and improve accuracy.
For severe weather events, satellite maps are indispensable. They help identify early signs of storm development, allowing for timely warnings and improved public safety.
Tools and Apps for Viewing Satellite Weather Maps
Today, satellite weather maps are more accessible than ever. Numerous websites and mobile apps provide real-time imagery, often with user-friendly interfaces designed for beginners.
Platforms like NOAA, NASA Worldview, and various weather apps offer high-quality satellite images with options to switch between visible, infrared, and water vapor views. Many tools also include animation features, allowing users to view satellite loops.
Interactive maps enable users to zoom in on specific regions, adjust overlays, and customize their viewing experience. This accessibility empowers individuals to explore weather patterns and develop their own interpretation skills.
Choosing a reliable source is important, as image quality and update frequency can vary. Look for platforms that provide clear labeling and educational resources to support your learning.
Building Your Skills Over Time
Learning to read satellite weather maps is a gradual process. At first, the images may seem overwhelming, but with consistent practice, patterns begin to emerge.
Start by focusing on one type of imagery, such as visible maps, and learn to identify basic cloud formations. Then, gradually incorporate infrared and water vapor imagery to deepen your understanding.
Comparing satellite images with local weather reports can also be helpful. By connecting what you see on the map with real-world conditions, you reinforce your interpretations and build confidence.
Over time, you’ll develop an intuitive sense of how weather systems behave, enabling you to anticipate changes and make informed observations.
The Future of Satellite Weather Technology
Advancements in satellite technology continue to enhance our ability to monitor and understand weather. Modern satellites offer higher resolution imagery, faster update times, and more sophisticated sensors.
Geostationary satellites, which remain fixed over a specific region, provide continuous monitoring, while polar-orbiting satellites offer detailed global coverage. Together, they create a comprehensive picture of Earth’s atmosphere.
Artificial intelligence and machine learning are also playing a growing role. These technologies can analyze vast amounts of satellite data, identify patterns, and improve forecasting accuracy.
As technology evolves, satellite weather maps will become even more powerful, offering deeper insights and greater accessibility for both professionals and enthusiasts.
Why Understanding Satellite Maps Matters
Understanding satellite weather maps is more than a technical skill—it’s a way to connect with the natural world. These maps reveal the dynamic processes shaping our atmosphere, from the formation of clouds to the movement of massive storm systems.
For individuals, this knowledge can enhance daily decision-making, from planning outdoor activities to preparing for severe weather. For communities, it contributes to awareness and resilience in the face of changing conditions.
In an era where weather patterns are becoming increasingly complex, the ability to interpret satellite imagery is a valuable and empowering skill.
Conclusion: Seeing the Bigger Picture
Satellite weather maps transform the invisible forces of the atmosphere into something we can see and understand. By learning to interpret cloud systems, recognize patterns, and analyze imagery, you gain access to a powerful perspective on the world around you.
What begins as a beginner’s guide can quickly evolve into a deeper fascination with meteorology and atmospheric science. With practice and curiosity, satellite maps become more than just images—they become a language, telling the story of Earth’s ever-changing skies.
Meta Description (max 155 characters):
Learn how to read satellite weather maps, understand cloud systems, and track storms with this beginner-friendly, expert guide.
Excerpt (max 65 words):
Unlock the power of satellite weather maps and discover how to read the sky from space. This beginner-friendly guide breaks down cloud systems, storm patterns, and real-time imagery, helping you understand weather like never before. Whether you’re curious or serious about forecasting, this guide turns complex visuals into clear, practical insights.
Ultra-Photorealistic Image Prompts:
Prompt 1:
Create an ultra-premium editorial scene of Earth viewed from space with dynamic swirling cloud systems and storm formations over oceans and continents, cinematic composition, soft atmospheric glow, deep contrast lighting, minimalist space environment, realistic cloud textures, high-resolution global illumination, shallow depth of field, neutral modern color palette, no text, no logos.
Prompt 2:
Create a photorealistic high-altitude satellite perspective of a massive weather system forming over Earth, with layered cloud bands, visible storm rotation, sunlight illuminating cloud tops, dramatic shadows, cinematic framing, ultra-sharp detail, realistic atmosphere scattering, minimalist composition, no text, no branding, no overlays.
Prompt 3:
Create an ultra-realistic editorial image of Earth’s atmosphere showing multiple cloud systems from orbit, including wispy cirrus and dense storm clusters, soft directional lighting, deep blacks of space, luminous highlights on clouds, modern premium aesthetic, cinematic depth, highly detailed textures, no text, no labels, no watermarks.